Newsroom
Calculate the stress distribution along the width of the bearing rollers
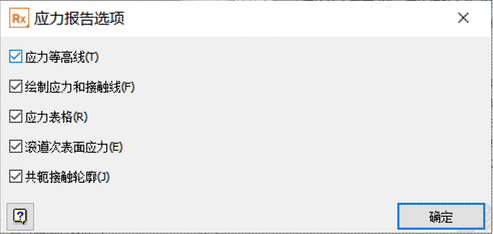
2024-03-17To view the bearing roller stresses, select the Rolling Element Stress pickbox. The Stress Report Options window pops up, where you can select the correct options. The surface stress options are only available for ball bearings. Select all options to display the most detailed rolling element stress results.

During the calculation, the roller is cut into many thin slices and the stress on each slice is calculated. Usually the thickness of the slices is consistent in the software, but for drum rollers, the thickness of the slices is automatically adjusted at the rounded corners. This adjustment improves the smooth transition performance of the predicted life or stress changes when we change the roller profile parameters.
The report includes the following:
- Maximum contact stress and stress safety factor — the ratio of the calculated maximum contact stress of the bearing to the maximum allowable contact stress. The contact stress of rolling bearings should not normally be greater than 4 GPa. A stress greater than this may cause permanent deformation of the rolling elements or raceways, leading to severe contact failure.

- Contact stress profiles - The bearing internal contact stress report is a curve of roller length and contact stress, showing the contact stress results for the inner race and outer race in two graphs.

The calculation results in a stress curve with smooth, uniform and symmetrical edges. The peak stress occurs near the middle of the roller width. If the bearing is severely misaligned, a skewed contact stress profile will result, and rollers with severe edge loads will have extremely large stress peaks at the edges.

- Contact stress contour plots - The stress calculation results are also used to create contact stress contour plots on the raceway surface. As shown in the load distribution plot, the maximum stress is also generated at 148 degrees.

- Footprint plots - The width of the contact footprint of the inner and outer raceways can also be plotted as a line graph. The width of the roller contact footprint is displayed on the raceway along the length of the roller and is defined as half the width of the contact ellipse at a certain point. Therefore, the contact footprint is proportional to the contact stress.

- Maximum stress on each roller - This table gives the maximum contact stress and maximum contact trace for each roller.

- Full stress results table – a complete report of all results.

- Conjugate contact profile - A combined profile of rollers and raceways is shown in graphs and tables. This profile can be used to reduce the effects of misalignment due to changes in load conditions and improve robustness.


